Cycling Trainer Hub — building a real product, AI-first
I ride indoors. Wahoo KICKR, Garmin HRM-Dual. And like every cyclist who gets too deep into the numbers, I wanted more out of my training data than Garmin Connect was giving me.
So I built something.
What it is
Cycling Trainer Hub is a full-stack platform for indoor cycling training. It connects directly to BLE devices — heart rate monitors, smart trainers, power meters — and gives you real-time data and deep post-session analytics.
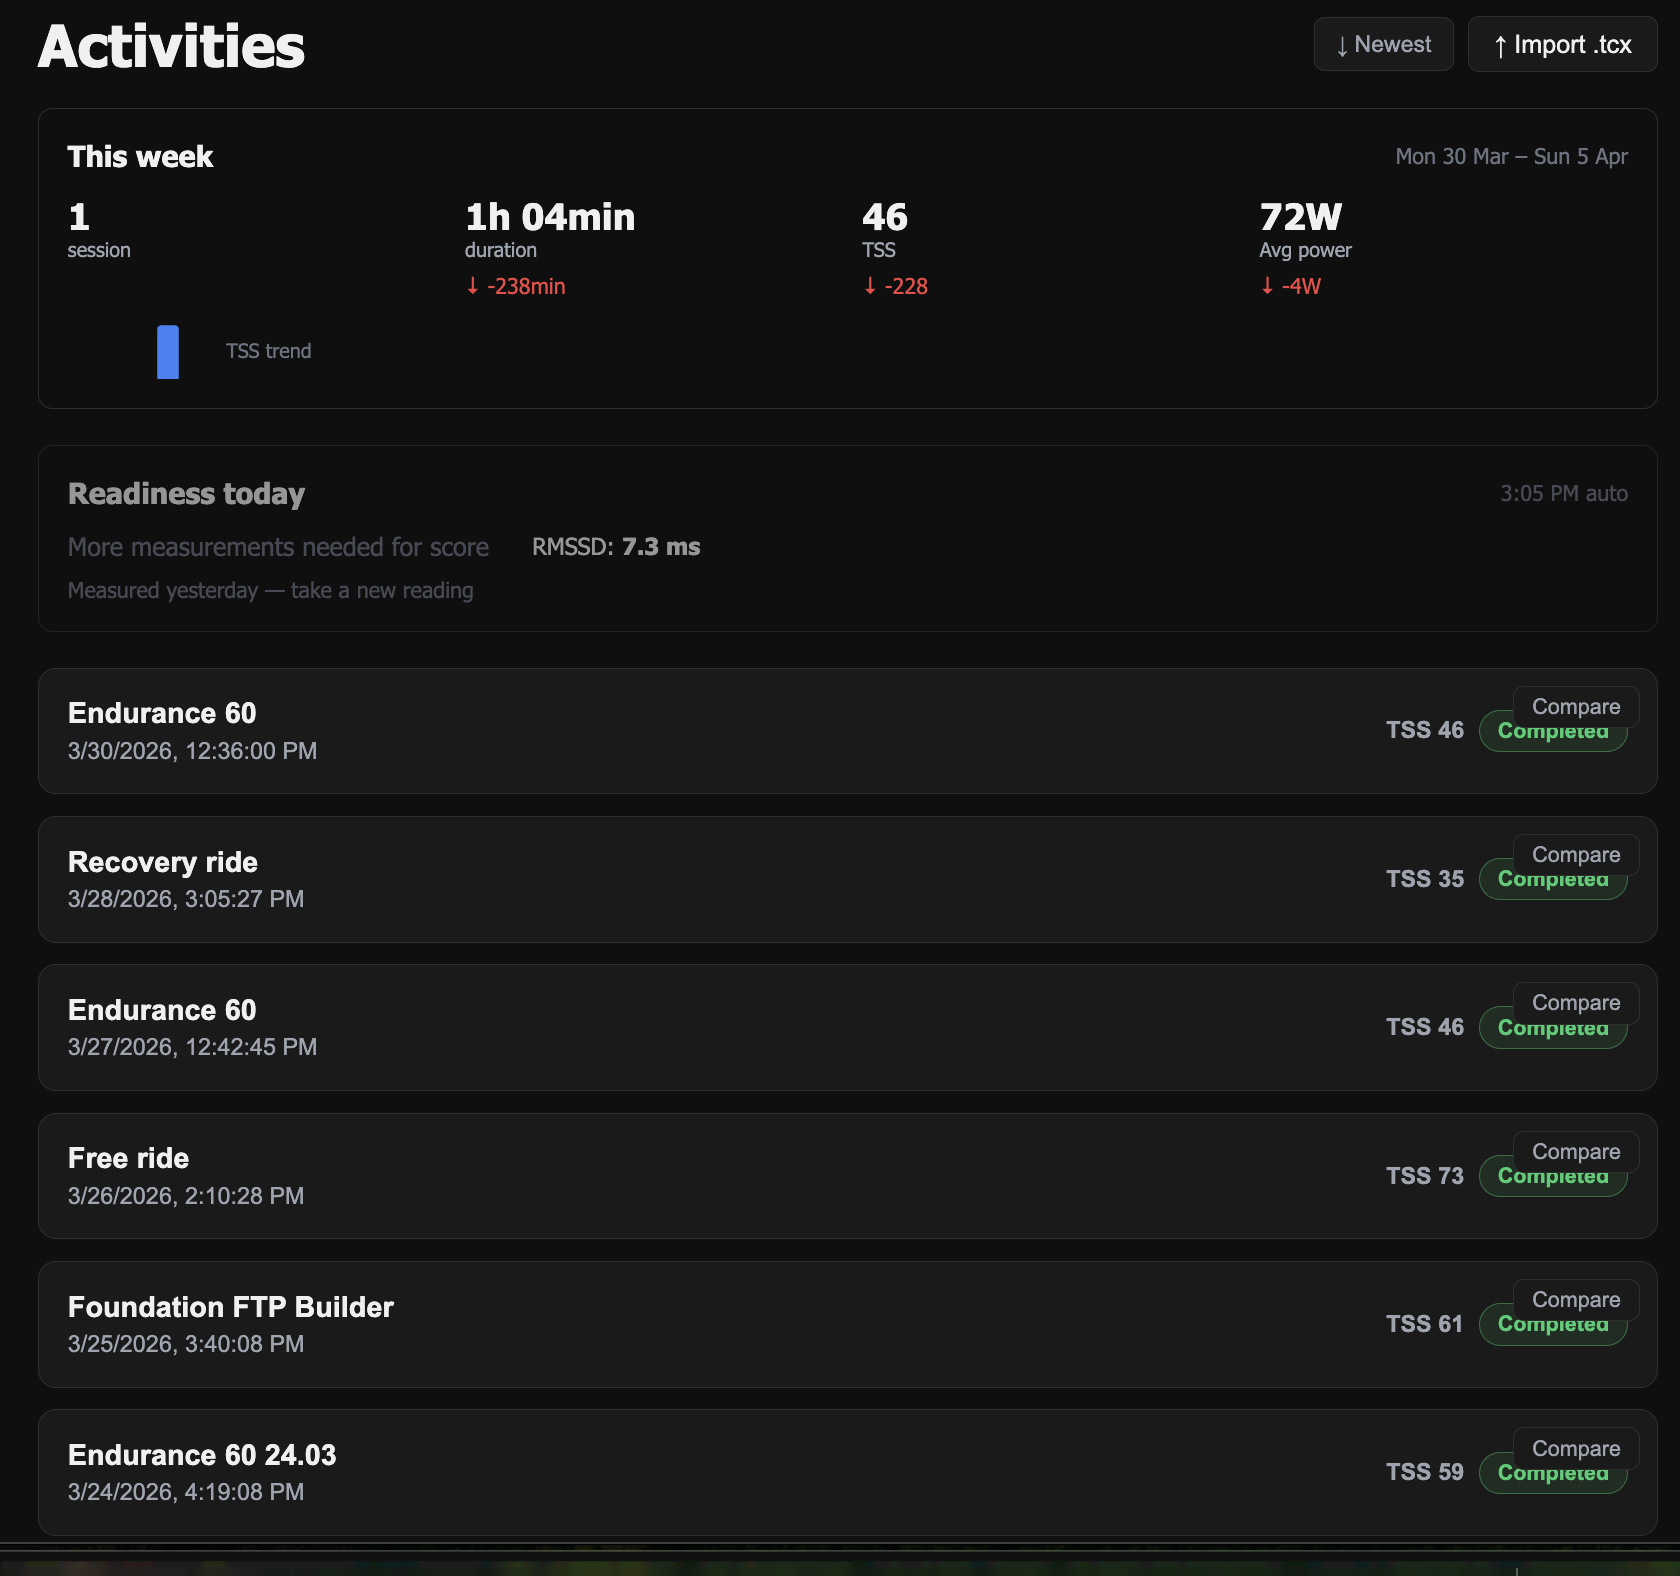
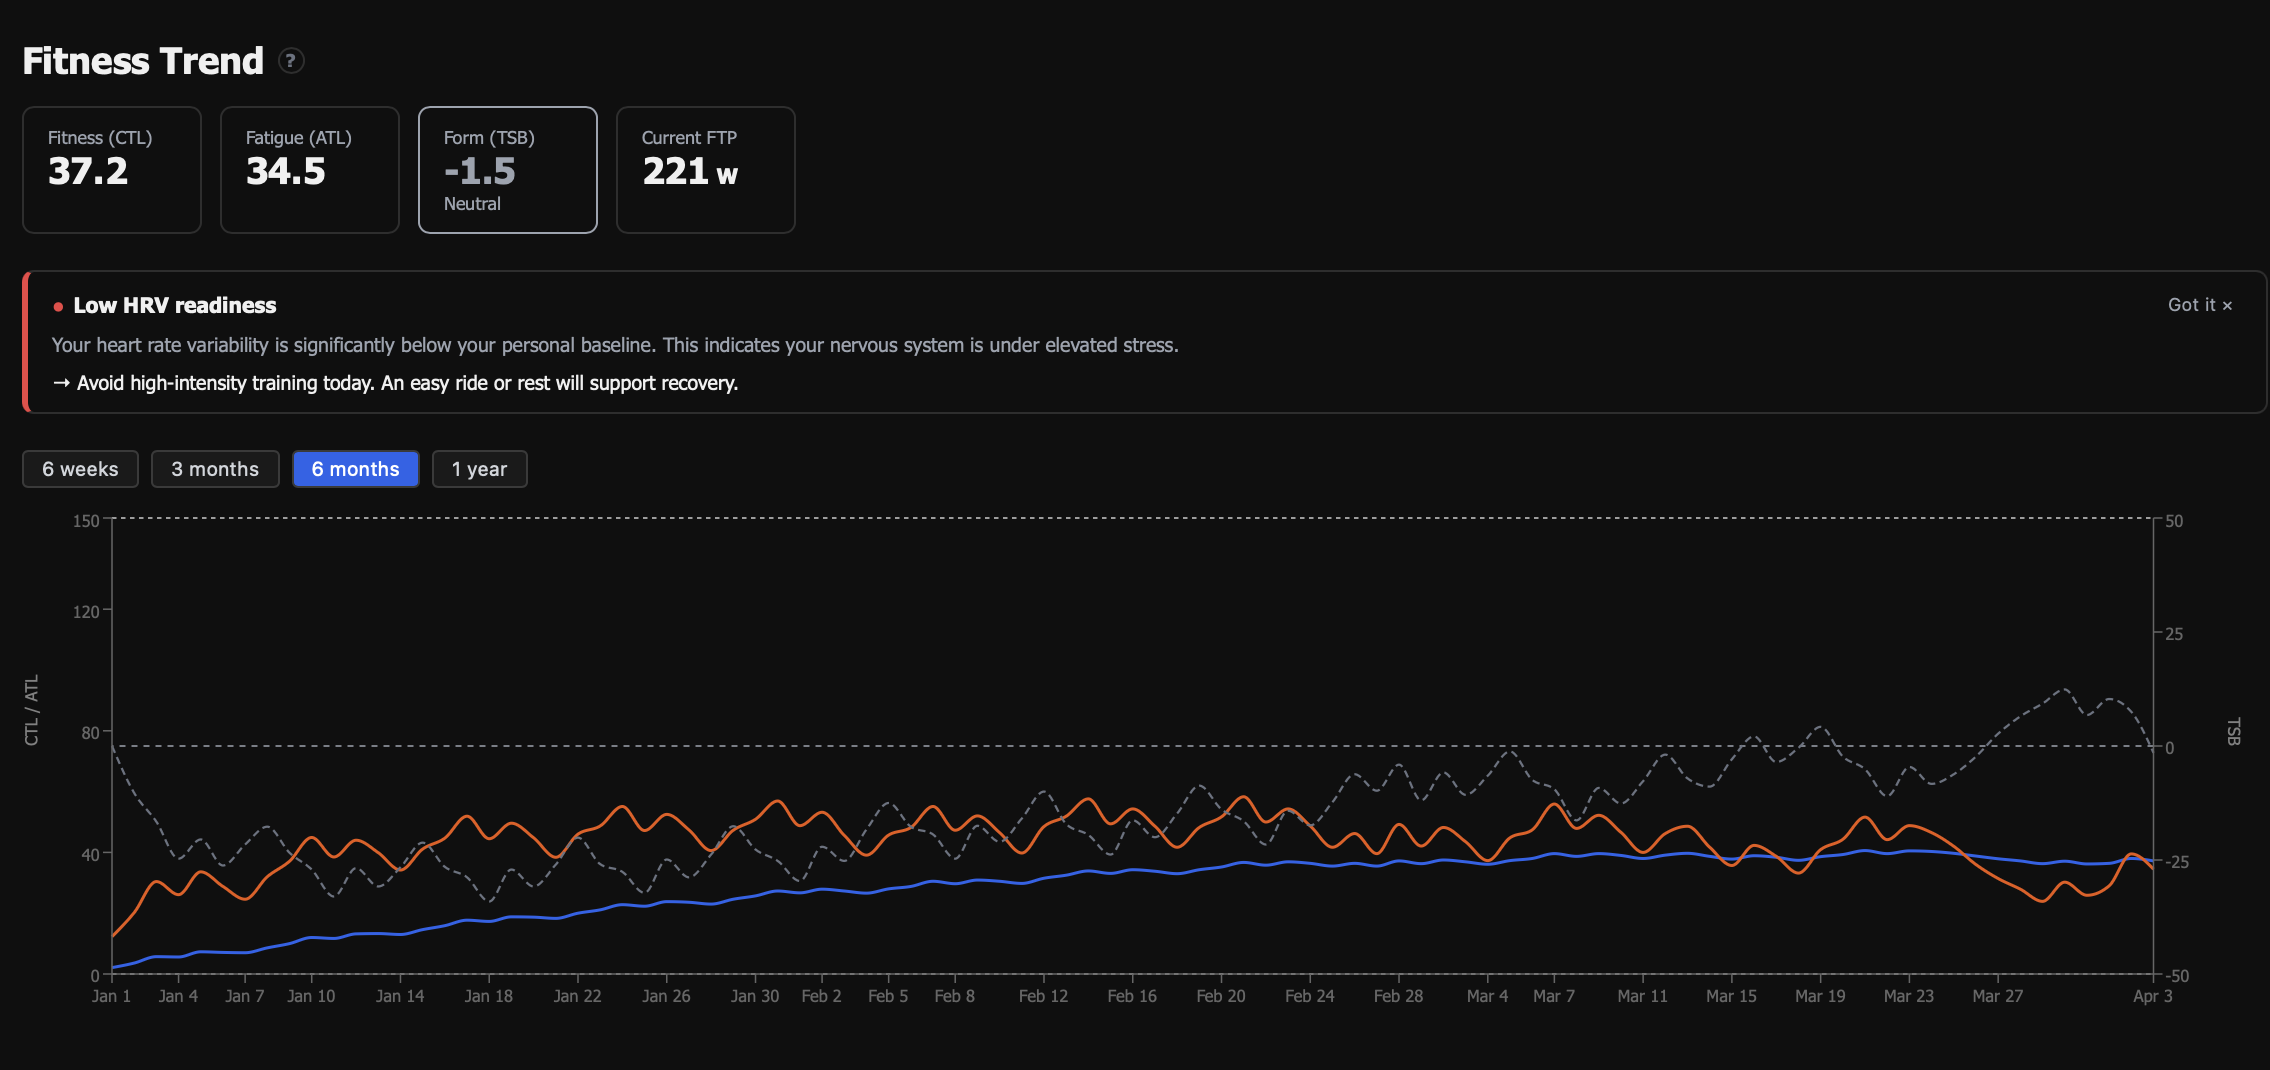
The dashboard shows what matters: weekly training load (TSS), readiness score based on HRV, and a full session history. The readiness score you see — 38, Low — is a real reading from that morning. The system told me to take it easy. I did not listen. The data knew better.
The features
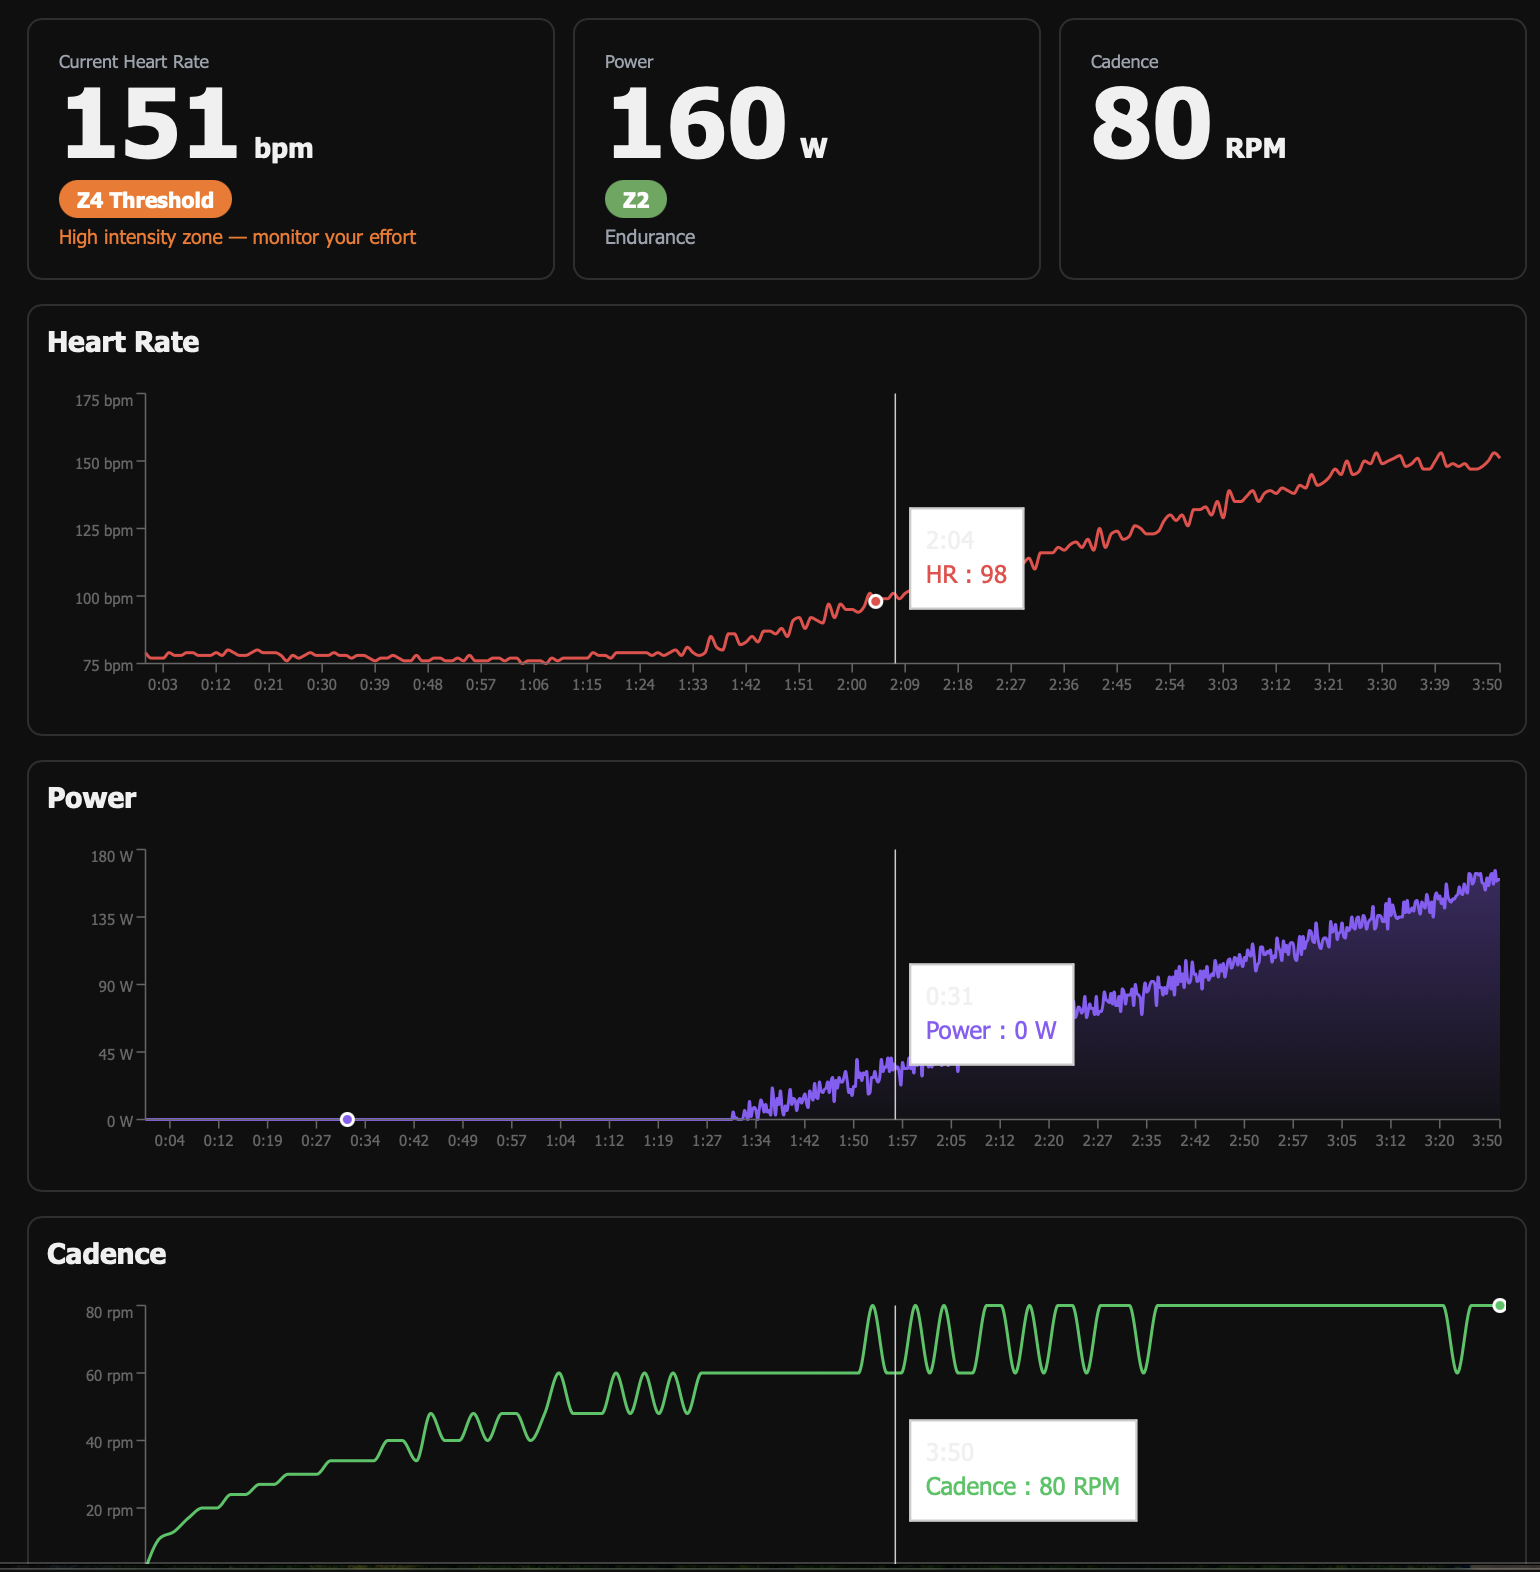
Real-time live session — HR, power, cadence, power zones, rolling averages. Compact mode for when you just want the numbers while riding.
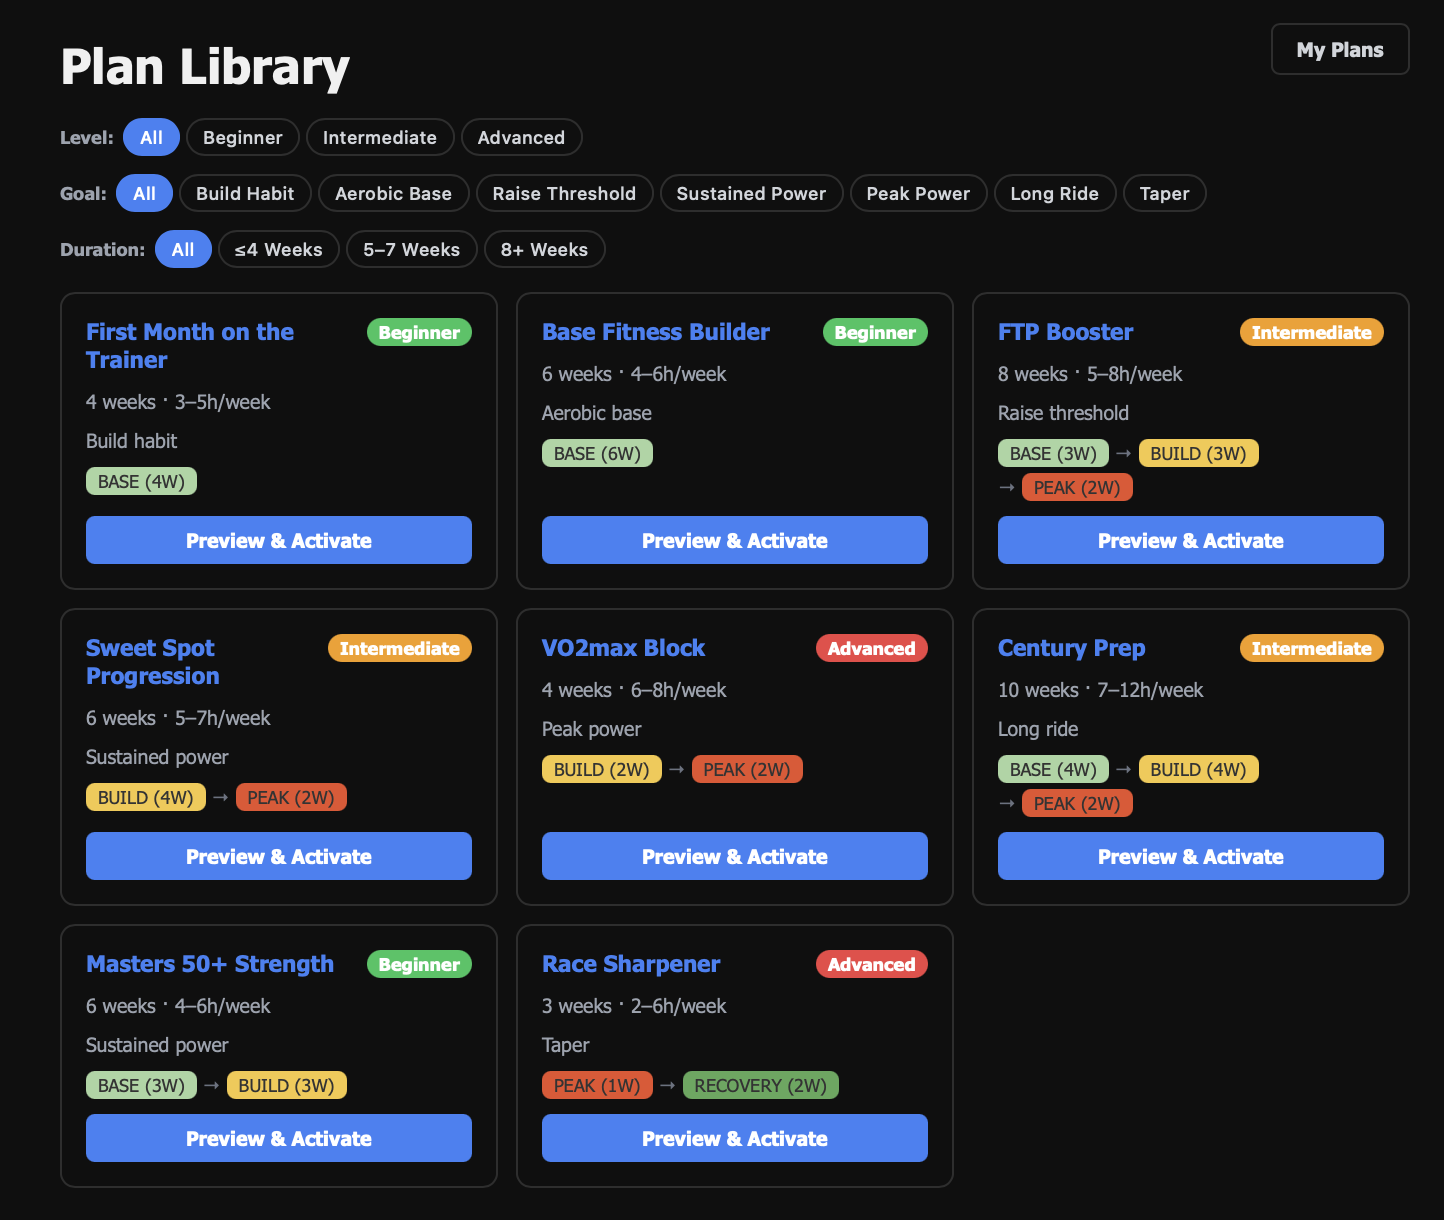
Training plans and workout library — 8 structured plans (beginner through advanced), filterable by level, goal, and duration. Custom workout builder with power zone targeting and a live power timeline preview.
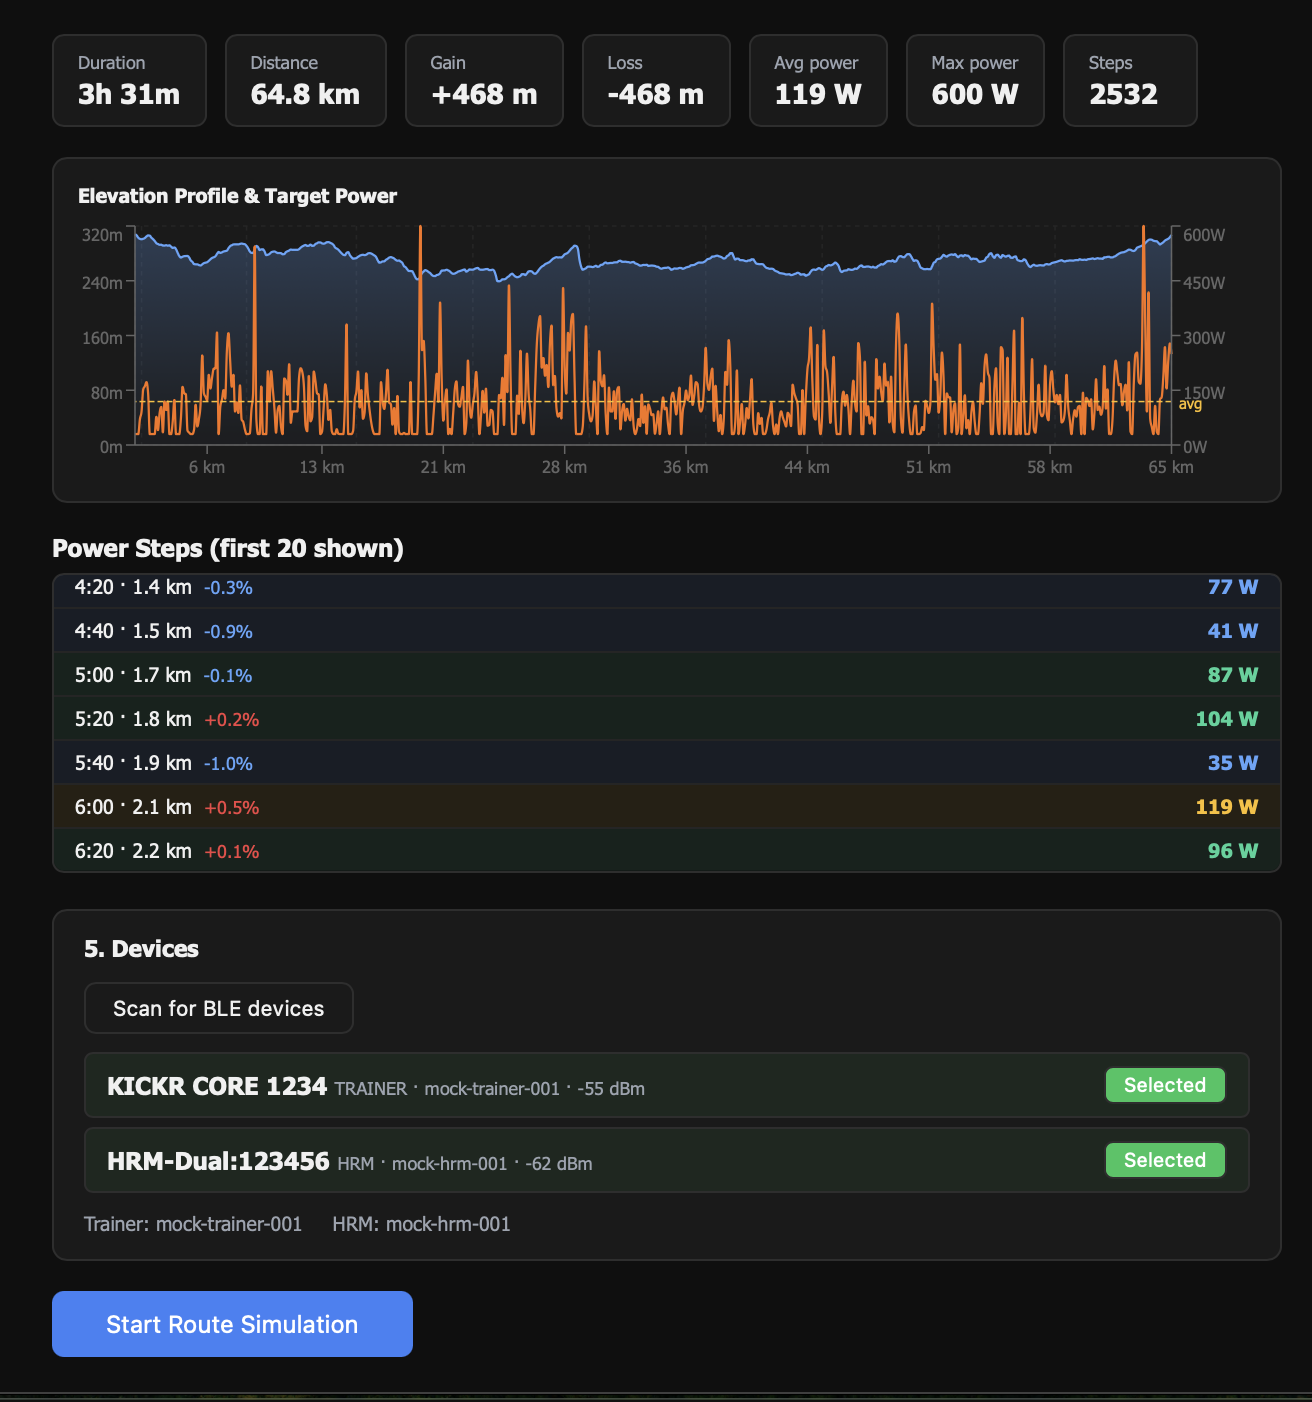
Route simulation — Load any GPX or TCX file. The app converts elevation to ERG power targets using a physics model (gravity + rolling resistance + aero drag), then sends those targets to the trainer in real time.
Fitness analytics — The Performance Management Chart (CTL/ATL/TSB) is what serious cyclists use to manage training load over time. CTL is fitness, ATL is fatigue, TSB is form. When TSB goes deeply negative, you're digging a hole.
HRV readiness — Every morning the app calculates an RMSSD from RR intervals captured during the first minutes of a session, compares it against a 30-day rolling baseline, and gives a score from 1 to 100. Below 50: recover. Above 70: push.
Personal records — Auto-detected best power across 1, 5, 10, 20, and 60-minute segments. Gold dot on the chart when a session sets a new record.
Session analytics — After each ride: normalised power, intensity factor, training stress score, aerobic decoupling, heart rate zones, RR interval trace. The kind of detail that usually requires a paid subscription elsewhere.
The stack
| Layer | Technology |
|---|---|
| API | Python · FastAPI · WebSocket |
| BLE | bleak (cross-platform) |
| Frontend | React · Recharts |
| Database | SQLite |
| Auth | JWT |
| Packaging | PyInstaller · Poetry |
Two backend services. The API server handles everything persistent — sessions, analytics, WebSocket streaming. A separate BLE monitor service handles device scanning and data collection. They are decoupled: you can browse history, plan workouts, and review analytics without any sensor connected.
Why I built it AI-first
I've been a QA engineer for 15 years. I know how to test software. What I wanted to explore was different: what happens when an AI is a genuine collaborator from line one — not a code-completion tool you call when stuck.
The result: you build faster, and you think more carefully.
When designing the BLE integration, I had to explain the GATT profile structure, characteristic UUIDs for heart rate and cycling power, the fact that RR intervals are packed in variable-length arrays. Articulating that clearly — not to a rubber duck but to something that could push back — made the implementation better.
The HRV algorithm is a good example. I knew RMSSD was the right metric. But sitting down to explain why, and working through edge cases (missing intervals, sensor dropout, very short sessions), produced a better implementation than I would have written alone.
This is not vibe-coding. The decisions are mine. The architecture is mine. The AI changed how I approached problems — less "write the code", more "let's think about this together."
What's being built next
AI Coaching Assistant — a conversational layer powered by Claude that gives personalised feedback based on your actual training data. Post-workout comments, weekly digests, and a warm welcome-back when you've been away. The coach sees your TSS, zone distribution, and CTL trend — and speaks to you like a knowledgeable friend, not a performance judge. A missed week is met with "welcome back, here's where you are", not "you lost X watts of fitness."
Strava and Garmin Connect Export — export sessions as .fit or .tcx files so your indoor training appears alongside outdoor rides. All the required data is already stored; this makes it visible to the rest of the cycling ecosystem.
Training Challenges and Streaks — consistency tracking, personal challenges, and streak rewards. The motivational feedback loop that keeps athletes coming back.
Current status
The project works. I use it. The data is real — the HRV baseline, the PMC, the session history you see in the screenshots.
Open source release coming. If you're curious about the BLE integration, the HRV math, the route physics model, or the AI-first approach — get in touch.
Stack: Python · FastAPI · React · BLE · SQLite · WebSocket · JWT
Status: Working · Open source release in progress